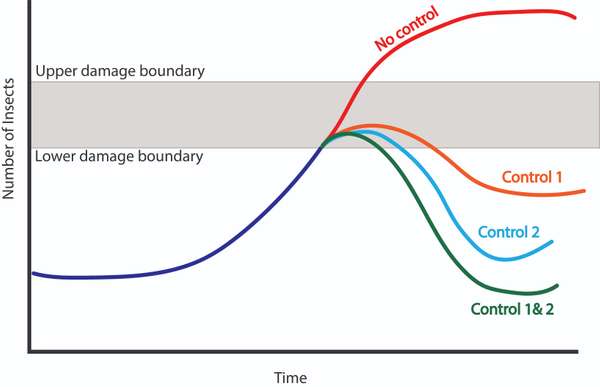
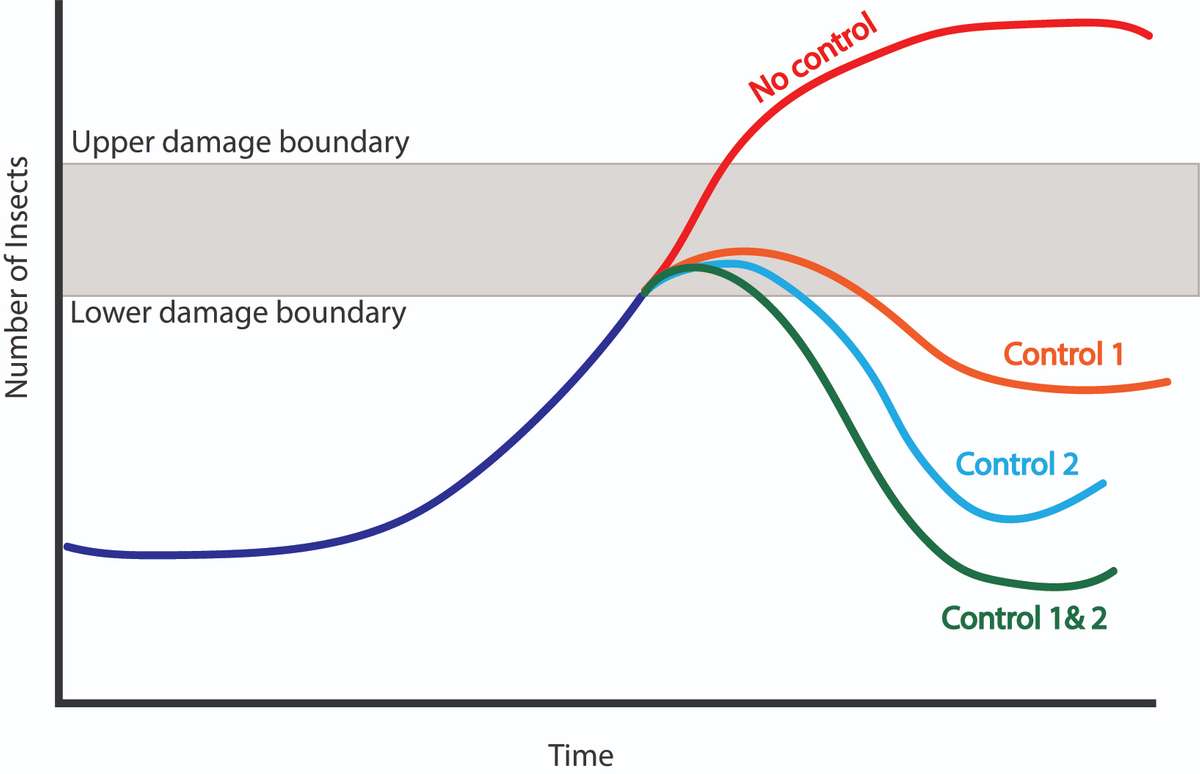
EDN152 Figure 7
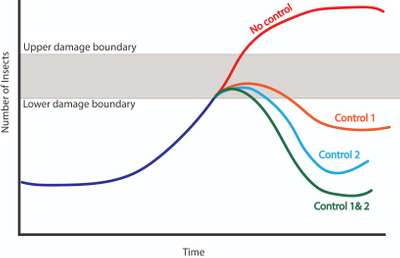
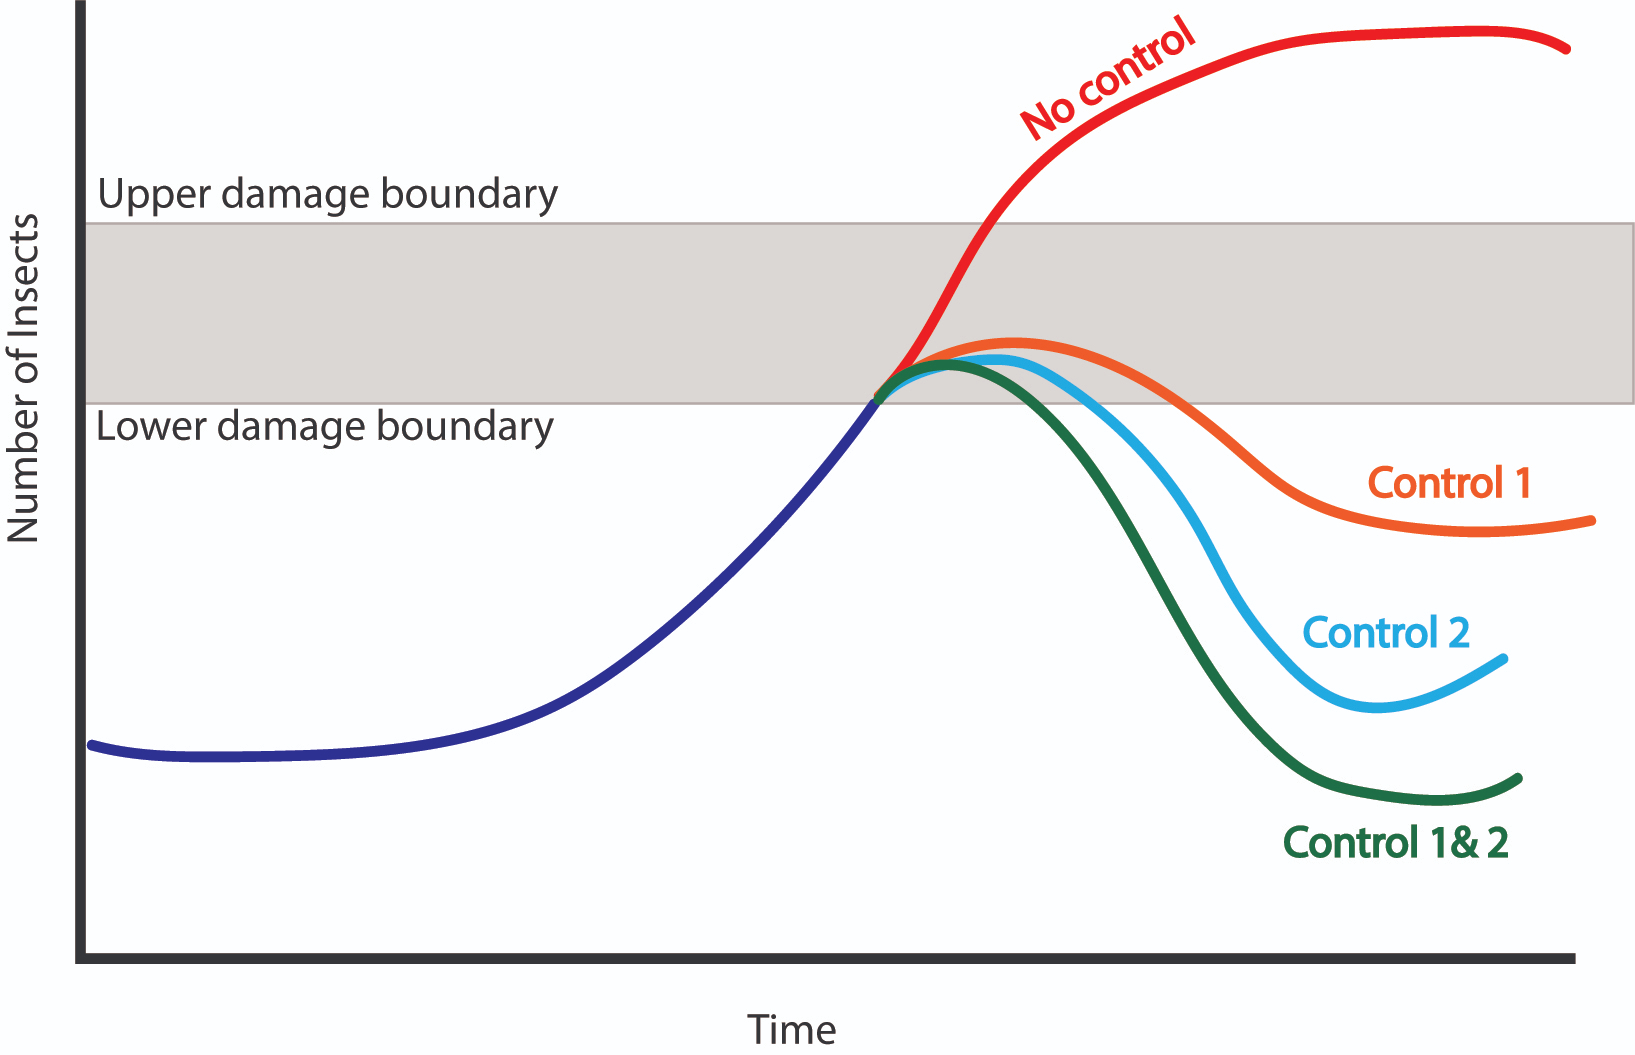
Figure 7. This diagram shows how different types of control strategies could impact a pest population. Control 1 doesn't reduce the population as much as control 2, but last a bit longer in its effectiveness. Combining both controls may have an even greater effect in reducing pest population. Source: Stacy Swartz