EDN164
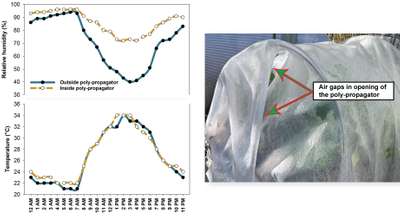
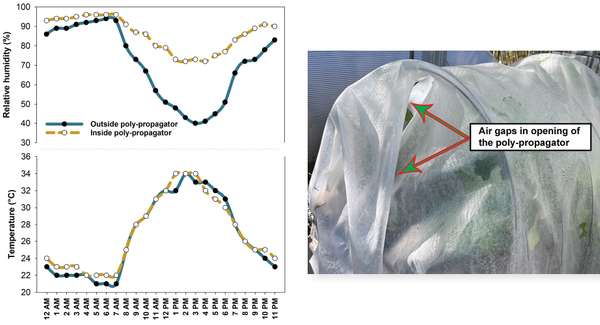
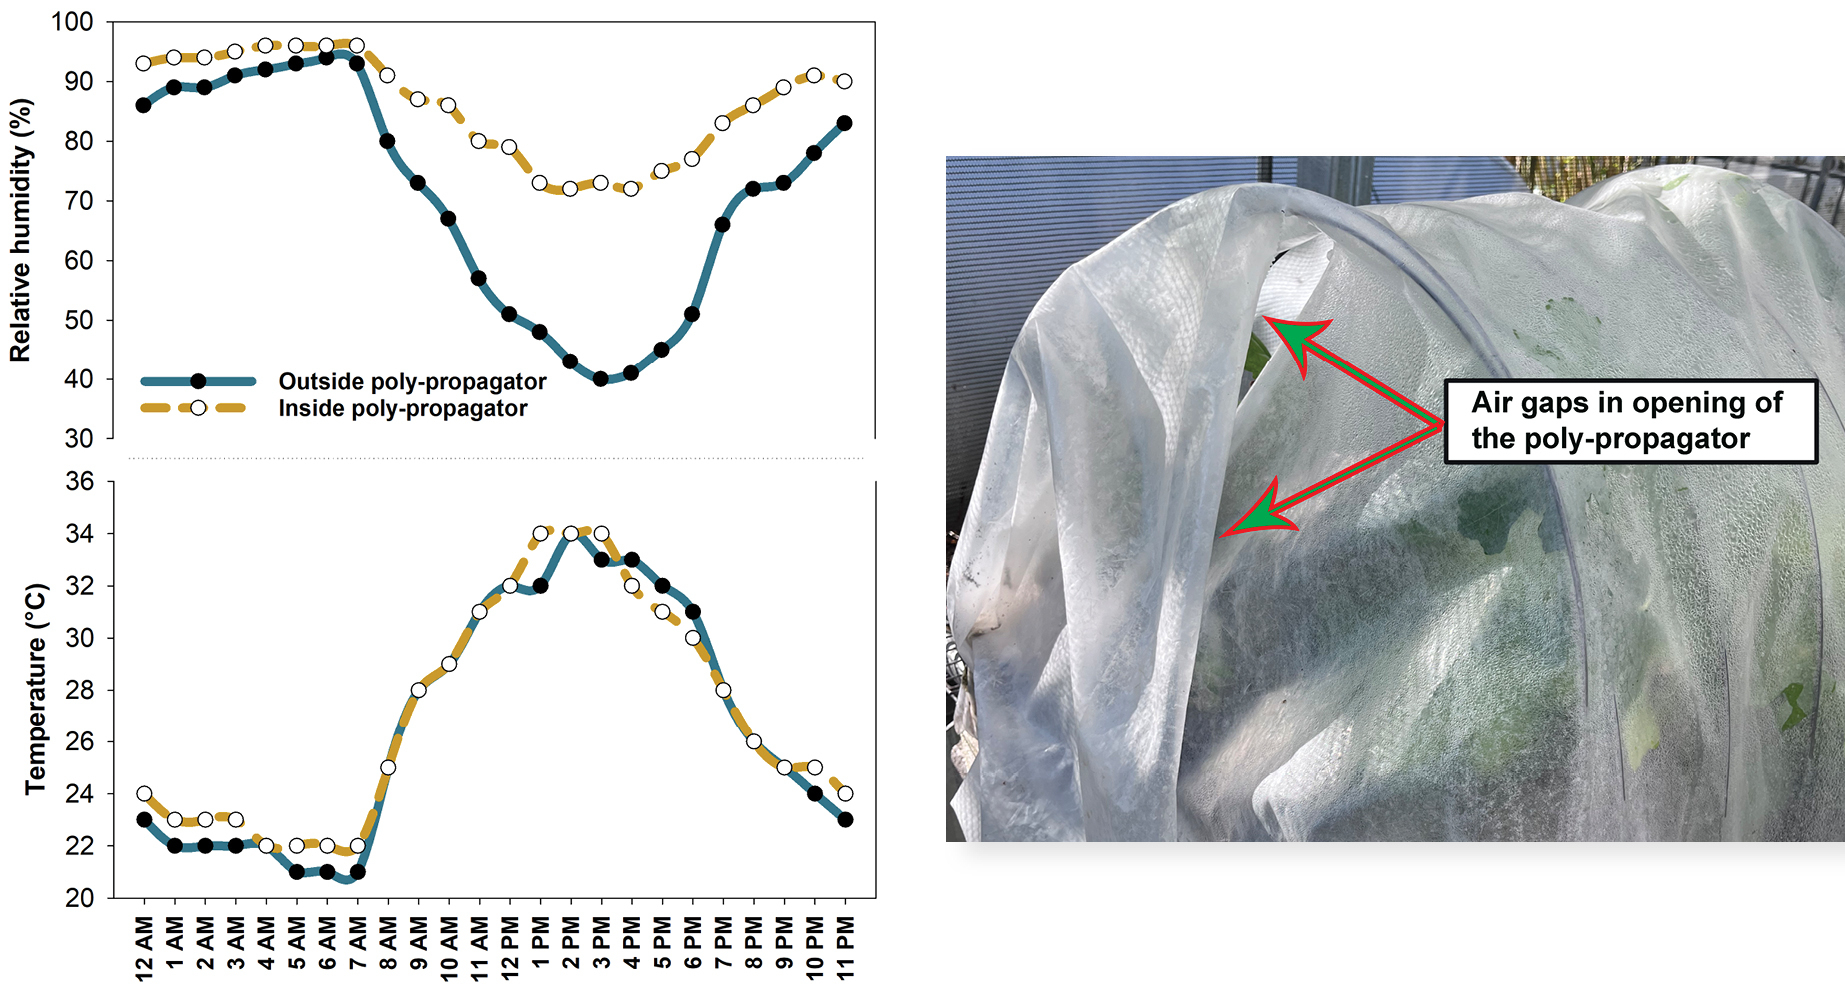
Figure 6. Air temperature and humidity (top) within and outside a poly-propagator (bottom) in a greenhouse at ECHO in southwest Florida. Each data point is the average of two or more logger readings taken from 3 to 5 May 2024. Source: Tim Motis